actual amounts to be paid out can only be determined at the time of such named executive officer’s termination of employment. The amounts set forth in the table below do not include compensation to which each named executive officer would be entitled without regard to histhe named executive officer’s termination of employment, including (i) base salary and short-term incentives that have been earned but not yet paid, and (ii) amounts that have been earned, but not yet paid, under the terms of the plans reflected in the Pension Benefits Table and the Nonqualified Deferred Compensation Table. There are no incremental payments in the event of voluntary resignation, termination for cause, disability or upon retirement.
| | | | | | | | | | | | | | | | | | | | |
| Potential Payments Upon Termination or Change in Control Table – Fiscal 2017 | |
| Name & Triggering Event | | Severance Pay($)(1)(2) | | | Equity Awards with Accelerated Vesting($)(3) | | | Nonqualified Retirement Benefits($)(4) | | | Welfare & Other Benefits($)(5) | | | Total($) | |
J. L. Walsh | | | | | | | | | | | | | | | | | | | | |
Death | | | 0 | | | | 8,262,620 | | | | 7,192,064 | | | | 0 | | | | 15,454,684 | |
Involuntary Termination Without Cause | | | 6,950,021 | | | | 0 | | | | 8,531,511 | | | | 63,152 | | | | 15,544,684 | |
Termination Following Change in Control | | | 9,725,158 | | | | 11,128,578 | | | | 12,438,585 | | | | 8,594,947 | | | | 41,887,268 | |
K. R. Oliver | | | | | | | | | | | | | | | | | | | | |
Death | | | 0 | | | | 2,496,249 | | | | 0 | | | | 0 | | | | 2,496,249 | |
Involuntary Termination Without Cause | | | 1,114,476 | | | | 0 | | | | 0 | | | | 40,541 | | | | 1,155,017 | |
Termination Following Change in Control | | | 2,337,486 | | | | 3,345,181 | | | | 247,890 | | | | 84,029 | | | | 6,014,586 | |
J. E. Sheridan | | | | | | | | | | | | | | | | | | | | |
Death | | | 0 | | | | 2,502,664 | | | | 0 | | | | 0 | | | | 2,502,664 | |
Involuntary Termination Without Cause | | | 1,994,444 | | | | 0 | | | | 0 | | | | 77,513 | | | | 2,071,957 | |
Termination Following Change in Control | | | 2,691,888 | | | | 3,954,331 | | | | 257,774 | | | | 104,944 | | | | 7,008,937 | |
R. Perreault | | | | | | | | | | | | | | | | | | | | |
Death | | | 0 | | | | 1,686,229 | | | | 0 | | | | 0 | | | | 1,686,229 | |
Involuntary Termination Without Cause | | | 910,252 | | | | 0 | | | | 0 | | | | 36,339 | | | | 946,591 | |
Termination Following Change in Control | | | 2,420,599 | | | | 2,200,865 | | | | 159,040 | | | | 56,020 | | | | 4,836,524 | |
M. M. Gaudiosi | | | | | | | | | | | | | | | | | | | | |
Death | | | 0 | | | | 1,771,649 | | | | 0 | | | | 0 | | | | 1,771,649 | |
Involuntary Termination Without Cause | | | 869,776 | | | | 0 | | | | 0 | | | | 28,062 | | | | 897,838 | |
Termination Following Change in Control | | | 1,830,522 | | | | 2,420,515 | | | | 186,836 | | | | 31,895 | | | | 4,469,768 | |
R. Perreault | | | | | | | | | | | | | | | |
Death | | | 0 | | | 3,451,035 | | | 0 | | | 0 | | | 3,451,035 |
Involuntary Termination Without Cause | | | 5,750,000 | | | 0 | | | 0 | | | 49,784 | | | 5,799,784 |
Termination Following Change in Control | | | 8,000,000 | | | 5,212,030 | | | 625,500 | | | 78,184 | | | 13,915,714 |
S. O’Brien | | | | | | | | | | | | | | | |
Death | | | 0 | | | 181,515 | | | 0 | | | 0 | | | 181,515 |
Involuntary Termination Without Cause | | | 2,187,501 | | | 0 | | | 0 | | | 52,006 | | | 2,239,507 |
Termination Following Change in Control | | | 3,312,501 | | | 499,790 | | | 0 | | | 53,343 | | | 3,865,634 |
R. Beard | | | | | | | | | | | | | | | |
Death | | | 0 | | | 1,065,552 | | | 2,996,908 | | | 0 | | | 4,062,460 |
Involuntary Termination Without Cause | | | 2,292,813 | | | 0 | | | 3,300,523 | | | 45,453 | | | 5,638,789 |
Termination Following Change in Control | | | 2,877,876 | | | 1,539,620 | | | 4,600,951 | | | 52,390 | | | 9,070,837 |
J. Koerwer | | | | | | | | | | | | | | | |
Death | | | 0 | | | 381,033 | | | 0 | | | 0 | | | 381,033 |
Involuntary Termination Without Cause | | | 1,291,257 | | | 0 | | | 0 | | | 50,662 | | | 1,341,919 |
Termination Following Change in Control | | | 1,979,927 | | | 534,520 | | | 0 | | | 51,104 | | | 2,565,551 |
J. Zagorski | | | | | | | | | | | | | | | |
Death | | | 0 | | | 746,868 | | | 0 | | | 0 | | | 746,868 |
Involuntary Termination Without Cause | | | 1,716,992 | | | 0 | | | 0 | | | 42,974 | | | 1,759,966 |
Termination Following Change in Control | | | 3,076,098 | | | 999,120 | | | 219,936 | | | 80,409 | | | 4,375,563 |
(1)
| Amounts shown under “Severance Pay” in the case of involuntary termination without cause are calculated under the terms of the UGI2021 Severance Plan for Messrs. Walsh, Oliver and Perreault and Ms. Gaudiosi and the AmeriGas Severance Plan for Mr. Sheridan.Plan. We assumed that 100 percent100% of the target annual bonus was paid. |
(2)
| Amounts shown under “Severance Pay” in the case of termination following a change in control are calculated under the officer’s change in control agreement. |
(3)
| In calculating the amounts shown under “Equity Awards with Accelerated Vesting”, we assumed (i) the continuation of the Company’s dividend (and AmeriGas Partners’ distribution, as applicable) at the rate in effect on September 30, 2017;2023; and (ii) performance at the greater of actual through September 30, 20172023 and target levels with respect to performance units. |
(4)
| Amounts shown under “Nonqualified Retirement Benefits” are in addition to amounts shown in the Pension Benefits Table – Fiscal 20172023 and the Nonqualified Deferred Compensation Table – Fiscal 2017. 2023. Mr. Beard participates in the UGI SERP and the UGI Pension Plan, each a defined benefit plan, while Messrs. O’Brien and Koerwer and Ms. Zagorski participate in the 2009 SERP, a defined contribution plan. |
(5)
| Amounts shown under “Welfare and Other Benefits” include estimated payments for (i) medical and dental insurance premiums, (ii) outplacement services and (iii) tax preparation services, and (iv) an estimated Code Section 280G taxgross-up payment of $8,536,896 for Mr. Walsh in the event of a change in control. services. |
The closing price of our Common Stock, as reported on the New York Stock Exchange Composite Tape on November 14, 2017,29, 2023, was $48.71.$21.84.
TABLE OF CONTENTS
The Dodd-Frank Wall Street Reform and Consumer Protection Act and related rules adopted by the SEC require disclosure of the ratio of the annual total compensation of its chief executive officer to the annual total compensation of its median employee. As permitted by SEC rules, we used the same median employee for Fiscal 2023 that we identified for Fiscal 2022 because there were no significant changes to the global employee population nor significant changes to employee compensation arrangements in Fiscal 2023. The following table shows the ratio of the annual total compensation of our former Chief Executive Officer, Roger Perreault, to that of our median employee for Fiscal 2023. In calculating the pay ratio, we did not utilize the “de minimis” exception, statistical sampling or other similar methods, or any cost-of-living adjustment, as permitted by applicable SEC regulations.
Annual total compensation of our former CEO for Fiscal 2023 | | | $9,960,170 |
Annual total compensation of our median employee for Fiscal 2023 | | | $67,391 |
Ratio of annual total compensation of our former CEO to the annual total compensation of our median employee for Fiscal 2023 | | | 148 to 1 |
Methodology:
1.
| Because there were no significant changes to our workforce or employee compensation arrangements in Fiscal 2023, the median employee that we used for purposes of calculating CEO pay ratio for Fiscal 2023 is the same median employee that we identified for disclosure in Fiscal 2022. |
2.
| With respect to the annual total compensation of the “median employee,” we identified and calculated the elements of such employee’s compensation for Fiscal 2023 in accordance with the requirements of Item 402(c)(2)(x) of Regulation S-K using Target Total Cash Compensation (base salary equivalent and overtime, plus incentive compensation and commissions) as our consistently applied compensation measure. |
3.
| With respect to the annual total compensation of our CEO, we used the amount reported in the “Total column (column (j))” of our Fiscal 2023 Summary Compensation Table included in this Proxy Statement. |
The SEC regulations for identifying the median-paid employee and calculating the CEO pay ratio allow companies to apply various methodologies and assumptions and, as a result, the CEO pay ratio reported above may not be comparable to the CEO pay ratio reported by other companies.
TABLE OF CONTENTS
Pay Versus Performance Disclosure
As required by Section 953(a) of the Dodd-Frank Wall Street Reform and Consumer Protection Act, and Item 402(v) of Regulation S-K, we are providing the following information about the relationship between compensation actually paid to our Named Executive Officers (“NEOs”) and certain financial performance metrics of the Company using a methodology that has been prescribed by the U.S. Securities and Exchange Commission. The disclosure does not necessarily reflect value actually realized by the NEOs or how the Committee evaluates compensation decisions in light of Company or individual performance. For discussion of how the Committee seeks to align pay with performance when making compensation decisions, please see the Compensation Discussion and Analysis beginning on page 29.
2023 | | | $9,960,170 | | | n/a | | | $2,087,247 | | | n/a | | | $2,146,817 | | | $508,745 | | | $78.44 | | | $108.98 | | | ($1,502.0) | | | $2.84 |
2022 | | | $6,060,694 | | | n/a | | | $2,096,450 | | | n/a | | | $2,036,182 | | | $526,688 | | | $105.02 | | | $117.20 | | | $1,073.0 | | | $2.90 |
2021 | | | $4,107,789 | | | $6,853,838 | | | $5,305,593 | | | $11,338,149 | | | $2,326,699 | | | $3,345,437 | | | $133.50 | | | $111.01 | | | $1,467.0 | | | $2.96 |
(1)
| Mr. Perreault became our principal executive officer (“PEO”) on June 26, 2021 and was our PEO through Fiscal 2023. As previously announced, Mr. Perreault has ceased to serve as President and Chief Executive Officer of the Company, effective December 12, 2023. Mr. Walsh, our former PEO, retired on June 26, 2021. Our non-PEO NEOs included: (a) for Fiscal 2023, Messrs. O’Brien, Jastrzebski, Beard and Koerwer and Mses. Zagorski and Gaudiosi; (b) for Fiscal 2022, Messrs. Jastrzebski and Beard and Mses. Zagorski and Gaudiosi; and (c) for Fiscal 2021, Messrs. Jastrzebski, Beard and Gallagher and Mses. Zagorski and Gaudiosi. |
(2)
| The following amounts were deducted from/added to Summary Compensation Table total compensation in accordance with the SEC-mandated adjustments to calculate Compensation Actually Paid (“CAP”) to our PEO and average CAP to our non-PEO named executive officers. The fair value of equity awards was determined using methodologies and assumptions developed in a manner substantively consistent with those used to determine the grant date fair value of such awards. |
Summary Compensation Table Total | | | $4,107,789 | | | $6,060,694 | | | $9,960,170 |
Deduct Change in Actuarial Present Value of Pension Plans Reported in Fiscal Year | | | —
| | | —
| | | —
|
Add Service Cost of Pension in Fiscal Year | | | —
| | | —
| | | —
|
Add Prior Service Cost of Pension in Fiscal Year | | | —
| | | —
| | | —
|
Deduct Grant Date Fair Value of Stock Awards Granted in Fiscal Year | | | (2,522,588)
| | | (4,158,984)
| | | (7,733,691)
|
Add-Deduct Fair Value at Fiscal Year-End of Outstanding and Unvested Stock Awards Granted in Fiscal Year | | | 2,855,539 | | | 1,999,801 | | | 1,454,565 |
Add-Deduct Change in Fair Value of Outstanding and Unvested Stock Awards Granted in Prior Fiscal Years | | | 745,506 | | | (2,073,984) | | | (1,912,144) |
Add-Deduct Fair Value at Vesting of Stock Awards Granted in Fiscal Year That Vested During Fiscal Year | | | — | | | — | | | — |
Add-Deduct Change in Fair Value as of Vesting Date of Stock Awards Granted in Prior Fiscal Years For Which Applicable Vesting Conditions Were Satisfied During Fiscal Year | | | 48,425 | | | 151,830 | | | 168,939 |
Deduct Fair Value as of Prior Fiscal Year-End of Stock Awards Granted in Prior Fiscal Years That Failed to Meet Applicable Vesting Conditions During Fiscal Year | | | (4,165) | | | (13,838) | | | (36,180) |
Add Dividends or Other Earnings Paid on Stock Awards in the Fiscal Year Prior to the Vesting Date that are not otherwise included in the Total Compensation for the Fiscal Year | | | 75,087 | | | 130,931 | | | 185,588 |
Compensation Actually Paid | | | $5,305,593 | | | $2,096,450 | | | $2,087,247 |
TABLE OF CONTENTS
Summary Compensation Table Total | | | $6,853,838 | | | n/a | | | n/a |
Deduct Change in Actuarial Present Value of Pension Plans Reported in Fiscal Year | | | — | | | | | | |
Add Service Cost of Pension in Fiscal Year | | | 571,123 | | | | | | |
Add Prior Service Cost of Pension in Fiscal Year | | | — | | | | | | |
Subtract Grant Date Fair Value of Stock Awards Granted in Fiscal Year | | | (4,000,639) | | | | | | |
Add-Deduct Fair Value at Fiscal Year-End of Outstanding and Unvested Stock Awards Granted in Fiscal Year | | | 5,650,907 | | | | | | |
Add-Deduct Change in Fair Value of Outstanding and Unvested Stock Awards Granted in Prior Fiscal Years | | | 1,934,202 | | | | | | |
Add-Deduct Fair Value at Vesting of Stock Awards Granted in Fiscal Year That Vested During Fiscal Year | | | — | | | | | | |
Add-Deduct Change in Fair Value as of Vesting Date of Stock Awards Granted in Prior Fiscal Years For Which Applicable Vesting Conditions Were Satisfied During Fiscal Year | | | 175,908 | | | | | | |
Deduct Fair Value as of Prior Fiscal Year-End of Stock Awards Granted in Prior Fiscal Years That Failed to Meet Applicable Vesting Conditions During Fiscal Year | | | (18,130) | | | | | | |
Add Dividends or Other Earnings Paid on Stock Awards in the Fiscal Year Prior to the Vesting Date that are not otherwise included in the Total Compensation for the Fiscal Year | | | 170,940 | | | | | | |
Compensation Actually Paid | | | $11,338,149 | | | n/a | | | n/a |
Average Summary Compensation Table Total | | | $2,326,699 | | | $2,036,182 | | | $2,146,817 |
Deduct Change in Actuarial Present Value of Pension Plans Reported in Fiscal Year | | | (4,416) | | | — | | | (112,777) |
Add Service Cost of Pension in Fiscal Year | | | 40,323 | | | 48,571 | | | 24,384 |
Add Prior Service Cost of Pension in Fiscal Year | | | — | | | — | | | — |
Deduct Grant Date Fair Value of Stock Awards Granted in Fiscal Year | | | (946,162) | | | (996,247) | | | (1,220,089) |
Add-Deduct Fair Value at Fiscal Year-End of Outstanding and Unvested Stock Awards Granted in Fiscal Year | | | 1,336,445 | | | 479,065 | | | 170,192 |
Add-Deduct Change in Fair Value of Outstanding and Unvested Stock Awards Granted in Prior Fiscal Years | | | 458,419 | | | (1,148,318) | | | (294,986) |
Add-Deduct Fair Value at Vesting of Stock Awards Granted in Fiscal Year That Vested During Fiscal Year | | | — | | | — | | | 3,411 |
Add-Deduct Change in Fair Value as of Vesting Date of Stock Awards Granted in Prior Fiscal Years For Which Applicable Vesting Conditions Were Satisfied During Fiscal Year | | | 93,323 | | | 76,365 | | | 48,985 |
Deduct Fair Value as of Prior Fiscal Year-End of Stock Awards Granted in Prior Fiscal Years That Failed to Meet Applicable Vesting Conditions During Fiscal Year | | | (2,135) | | | (12,696) | | | (254,651) |
Add Dividends or Other Earnings Paid on Stock Awards in the Fiscal Year Prior to the Vesting Date that are not otherwise included in the Total Compensation for the Fiscal Year | | | 42,941 | | | 43,766 | | | (2,541) |
Average Compensation Actually Paid for NEOs | | | $3,345,437 | | | $526,688 | | | $508,745 |
(3)
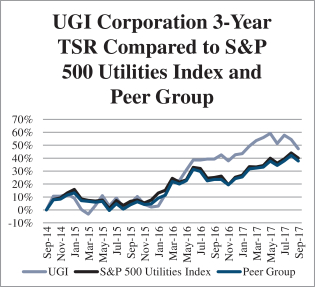
| The Peer Group for which TSR is provided in column (g) is the S&P 500 Utilities Index. |
(4)
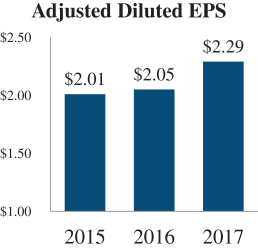
| Adjusted EPS is a Non-GAAP financial measure. For a discussion of adjustments, please see the “Executive Summary” section of our Compensation Discussion and Analysis. |
TABLE OF CONTENTS
The following graphs present the relationship during 2023, 2022, and 2021 between (1) CAP to (a) each person serving as PEO and (b) our other NEOs on an average basis, and each of (2) (a) the Company’s and Peer Group’s TSR for such years and (b) the Company’s Net Income and Adjusted EPS for such years.
| | | • Adjusted EPS • Safety - OSHA recordables • Diversity & Inclusion goals • Relative TSR |
| SECURITIES OWNERSHIP OF CERTAIN BENEFICIAL OWNERS | | |
Security Ownership of Directors and Executive Officers
The following table shows the number of shares beneficially owned by each Director, by each of the executive officers named in the Summary Compensation Table, and by all Directors and executive officers as a group. The table shows their beneficial ownership as of October 1,
2017.2023. The address for each beneficial owner in the table below is c/o UGI Corporation, P.O. Box 858, Valley Forge, PA 19482.
Mr. Walsh beneficially owns approximately 1.07 percent of the outstanding common stock.
Each other person named in the table beneficially owns less than
1 percent1.0% of the outstanding common stock. Directors and executive officers as a group own approximately
2.36 percent1.2% of the outstanding common stock. For purposes of reporting total beneficial ownership, shares that may be acquired within 60 days of October 1,
20172023 through UGI Corporation stock option exercises are included.
Beneficial Ownership of Directors, Nominees and Named Executive Officers
| | | | | | | | | | | | | | |
Name | | Number
of Shares of UGI
Common Stock(1) | | | | | Number of UGI
Stock Units(2) | | | Exercisable
Options
For UGI
Common Stock | |
M. Shawn Bort | | | 6,525 | | | (3) | | | 37,343 | | | | 105,750 | |
Theodore A. Dosch | | | 0 | | | | | | 1,500 | | | | 4,500 | |
Monica M. Gaudiosi | | | 48,671 | | | | | | 0 | | | | 290,333 | |
Richard W. Gochnauer | | | 0 | | | | | | 27,934 | | | | 80,250 | |
Frank S. Hermance | | | 150,000 | | | (4) | | | 25,630 | | | | 73,875 | |
Kirk R. Oliver | | | 60,714 | | | (5) | | | 0 | | | | 302,583 | |
Anne Pol | | | 5,367 | | | | | | 137,135 | | | | 93,000 | |
Roger Perreault | | | 14,906 | | | (6) | | | 0 | | | | 16,666 | |
Marvin O. Schlanger | | | 78,336 | | | (7) | | | 119,373 | | | | 112,150 | |
Jerry E. Sheridan | | | 2,051 | | | (8) | | | 0 | | | | 61,666 | |
James B. Stallings, Jr. | | | 0 | | | | | | 7,030 | | | | 20,800 | |
Roger B. Vincent | | | 22,516 | | | (9) | | | 52,525 | | | | 42,000 | |
John L. Walsh | | | 421,617 | | | (10) | | | 0 | | | | 1,451,500 | |
Directors and executive officers as a group (16 persons) | | | 890,273 | | | | | | 408,470 | | | | 2,857,322 | |
Robert F. Beard | | | 50,915 | | | 0 | | | 289,196 |
M. Shawn Bort | | | 14,345 (3) | | | 60,522 | | | 64,290 |
Theodore A. Dosch | | | 22,000 | | | 18,005 | | | 48,540 |
Monica M. Gaudiosi | | | 61,109 | | | 0 | | | 484,026 |
Alan N. Harris | | | 0 | | | 15,664 | | | 42,540 |
Frank S. Hermance | | | 465,000 (4) | | | 56,011 | | | 112,740 |
Ted J. Jastrzebski | | | 21,279 (5) | | | 0 | | | 0 |
John Koerwer | | | 15,687 (6) | | | 0 | | | 70,339 |
Mario Longhi | | | 0 | | | 9,871 | | | 26,910 |
William J. Marrazzo | | | 932 | | | 11,541 | | | 32,650 |
Cindy J. Miller | | | 0 | | | 9,083 | | | 23,540 |
Sean P. O’Brien | | | 0 | | | 0 | | | 0 |
Roger Perreault | | | 41,125 | | | 0 | | | 387,429 |
Kelly A. Romano | | | 0 | | | 12,761 | | | 35,040 |
Santiago Seage | | | 0 | | | 0 | | | 0 |
Judy A. Zagorski | | | 2,142 | | | 0 | | | 57,693 |
Directors and executive officers as a group (18 persons) | | | 694,534 | | | 193,458 | | | 1,679,816 |
(1)
| Sole voting and investment power unless otherwise specified. |
(2)
| The 2004 Omnibus Equity Compensation Plan, the 2013 Plan, and the 20132021 Plan each provides that stock units will be converted to shares and paid out to Directors upon their retirement or termination of service. |
(3)
| Ms. Bort’s shares are held jointly with her spouse. |
(4)
| Mr. Hermance holds these shares jointly with his spouse. |
(5) | Includes 3,255 shares held jointly with Mr. Oliver’s spouse and 611 shares in his UGI Savings Plan.
|
(6) | Does not include 12,000 shares of restricted stock.
|
(7) | Includes 3,000 shares held by Mr. Schlanger’s spouse. Mr. Schlanger disclaims beneficial ownership of the shares owned by his spouse.
|
(8) | Mr. Sheridan holds these shares in his AmeriGas Savings Plan.
|
(9) | Includes 15,000 shares in a family trust for which Mr. Vincent’s spouse is a trustee. Mr. Vincent disclaims beneficial ownership of the shares held in the family trust.
|
(10) | Mr. Walsh’sHermance’s shares are held jointly with his spouse.
|
(5)
| Mr. Jastrzebski holds 7,650 shares jointly with his spouse. |
(6)
| Mr. Koerwer holds 13,518 shares jointly with his spouse. |
TABLE OF CONTENTS
Securities Ownership of Certain Beneficial Owners
The following table shows information regarding each person known by the Company to be the beneficial owner of more than five percent of the Company’s common stock. The ownership information below is based on information reported on a Form 13F as filed with the SEC in November
20172023 for the quarter ended September 30,
2017.2023.
Securities Ownership of Certain Beneficial Owners
| | | | | | | | | | |
Title of Class | | Name and Address of Beneficial Owner | | Amount and Nature of Beneficial Ownership | | | Percent of Class(1) | |
Common Stock | | The Vanguard Group, Inc. 100 Vanguard Blvd. Malvern, PA 19355 | | | 17,128,929(2) | | | | 9.89% | |
Common Stock | | Blackrock Inc. 55 East 52nd Street New York, NY 10055 | | | 16,159,555(3) | | | | 9.33% | |
Common Stock | | Wellington Management Group LLP c/o Wellington Management Company LLP 280 Congress Street Boston, MA 02210 | | | 10,469,761(4) | | | | 6.05% | |
Common Stock | | State Street Corporation State Street Financial Center One Lincoln Street Boston, MA 02111 | | | 8,936,871(5) | | | | 5.16% | |
Common Stock | | | The Vanguard Group, Inc.
P.O. Box 2600
Valley Forge, PA 19482 | | | 26,271,972 (2) | | | 12.54% |
Common Stock | | | BlackRock Inc.
55 East 52nd Street
New York, NY 10055 | | | 26,920,187 (3) | | | 12.84% |
(1)
| Based on 173,143,737209,502,512 shares of common stock issued and outstanding at September 30, 2017. 2023. |
(2)
| The reporting person, and certain related entities, hashave shared voting power with respect to 32,20172,809 shares, soleno voting power with respect to 139,14126,199,163 shares, shared investment power with respect to 158,039274,036 shares, and sole investment power with respect to 16,970,89025,997,963 shares. |
(3)
| The reporting person, and certain related entities, has sole voting power with respect to 14,422,43926,076,783 shares, no voting power with respect to 843,404 shares, shared investment power with respect to 880 shares, and sole investment power with respect to 16,159,55526,920,187 shares. |
(4) | The reporting person, and certain related entities, has sole voting power with respect to 9,136,235 shares and shared investment power with respect to 10,469,761 shares.
|
(5) | The reporting person, and certain related entities, has sole voting power with respect to 837,182 shares and shared investment power with respect to 8,936,871 shares.
|
Delinquent Section 16(a)
Beneficial Ownership Reporting ComplianceReports
Section 16(a) of the Exchange Act requires our Directors, certain officers and 10 percent10% beneficial owners to report their ownership of shares and changes in such ownership to the SEC. Based on our records, we believe that, during Fiscal 2017,2023, all of such reporting persons complied with all Section 16(a) reporting requirements applicable to them. However, Ms. Marie-Dominique Ortiz-Landazabal, the Company’s Vice President – Accounting and Financial Control and Chief Accounting Officer, was inadvertently late in filing one Form 4 relating to an equity grant due to an administrative error.
|
ITEMItem 2 — ADVISORY VOTE ONAdvisory Vote on UGI CORPORATION’S EXECUTIVE COMPENSATIONCorporation’s
Executive Compensation |
Pursuant to Section 14A of the Exchange Act, the Company is providing shareholders with the opportunity to cast an advisory,
non-binding vote to approve the compensation of our named executive officers. The compensation of our named executive officers is disclosed under the headings “Compensation Discussion and Analysis” and “Compensation of Executive Officers” beginning on pages
2129 and
41,46, respectively, of this Proxy Statement. At the
20162023 Annual Meeting,
overnearly 96% of our
voting shareholders voted to approve the compensation of our named executive
officers and, at our 2022 Annual Meeting, nearly 95% of our voting shareholders voted to approve the compensation of our named executive officers.
We believe that the interests of our named executive officers and our shareholders are closely aligned. As described in the Compensation Discussion and Analysis, the compensation program for our named executive officers is designed to provide a competitive level of total compensation, to motivate and encourage our executive officers to contribute to the Company’s success and to effectively link our executives’ compensation to our financial performance and sustainable growth in shareholder value. The Compensation Discussion and Analysis also describes in detail the components of our executive compensation program and the process by which, and the reasons why, the independent members of our Board of Directors and our Compensation and Management Development Committee make executive compensation decisions.
In making executive compensation decisions, our Compensation and Management Development Committee seeks to implement and maintain sound compensation and corporate governance practices, which include the following:
Our Compensation and Management Development Committee is composed entirely of directorsDirectors who are independent, as defined in the corporate governance listing standards of the New York Stock Exchange.
Our Compensation and Management Development Committee utilizes the services of Pay Governance LLC, an independent outside compensation consultant.
The Company allocates a substantial portion of compensation to performance-based compensation. In Fiscal 2017, 81%2023, 75% of the principal compensation components, in the case of Mr. Walsh,Perreault, and 65%58% to 75%68% of the principal compensation components, in the case of all other named executive officers, were variable and tied to financial performance or TSR.
objectives.The Company awards a substantial portion of compensation in the form of long-term awards, namely performance stock units, restricted stock units, and stock options, and performance units, so that executive officers’ interests are aligned with shareholders’ interests and long-term Company performance.
Annual bonus opportunities for the named executive officers are based primarily on key financial metrics.metrics, safety performance, and diversity and inclusion goals. Similarly, long-term incentives are based on UGI Corporation common stock values and relative stock price performance (or, in the case of Mr. Sheridan, performance relative to AmeriGas Partners common units and other key strategic goals).
performance.| • | We require termination of employment for payment under our change in control agreements (referred to as a “double trigger”). In addition, we require a double trigger for the accelerated vesting of equity awards in the event of a change in control. None of our named executive officers have change in control agreements providing for tax gross-up payments under Section 280G of the Internal Revenue Code. See COMPENSATION OF EXECUTIVE OFFICERS — Potential Payments Upon Termination or Change in Control, beginning on page 57. |
| • | We have robust stock ownership and retention guidelines. See COMPENSATION OF EXECUTIVE OFFICERS — Stock Ownership and Retention Policy, beginning on page 44. |
TABLE OF CONTENTS
We require termination of employment for payment under our change in control agreements (referred to as a “double trigger”). In addition, we require a double trigger for the accelerated vesting of equity awards in the event of a change in control. We have not entered into change in control agreements providing for taxgross-up payments under Section 280G of the Internal Revenue Code since 2010. See COMPENSATION OF EXECUTIVE OFFICERS — Potential Payments Upon Termination or Change in Control, beginning on page 51.
We have meaningful stock ownership guidelines. See COMPENSATION OF EXECUTIVE OFFICERS — Equity Ownership Policy, beginning on page 39.
We have a recoupment policy for incentive-based compensation paid or awarded to current and former executive officers in the event of a restatement due to materialnon-compliance withcorrect an error (i) in previously issued financial reporting requirements.
statements that is material to the previously issued financial statements, or (ii) that would result in a material misstatement if the error were corrected in the current period or left uncorrected in the current period, pursuant to the rules of the NYSE and the Securities and Exchange Commission.